Mitochondrial Ultrastructure is Optimized for Synaptic Performance
Cserép and colleagues examined whether mitochondrial ultrastructure differs with respect to the activity needs of synaptic boutons. Identified by known morphological or neurochemical criteria, 3D models of bouton types with two different performance levels were reconstructed from serial electron microscopy and high-resolution electron-tomography images. Compared to low-performance boutons, high-performance boutons contained significantly larger mitochondria and cristae that were more lamellar in appearance (Figure 1). These results demonstrated a morphological correlation between mitochondrial ultrastructure and synaptic performance. Similar differences were observed for low-performance and high-performance boutons in both glutamatergic- and GABAergic cells in the hippocampus, showing that mitochondrial ultrastructural optimization is related to synaptic activity rather than cell type. In addition to these morphological observations, a functional variation was demonstrated by a higher density of respiratory chain protein, cytochrome c, labeling in the high-performance compared to low-performance strong correlation between active zone area and the volume of individual presynaptic mitochondria in glutamatergic axon segments from CA1 of post-mortem human tissue confirmed that this mitochondrial adaptation to synaptic performance is evolutionarily conserved. As neurons have particularly high energy demands, this finding could be applied to examine morpho-functional abnormalities in human post-mortem brain tissue to understand the mechanisms of neurodegenerative disorders.
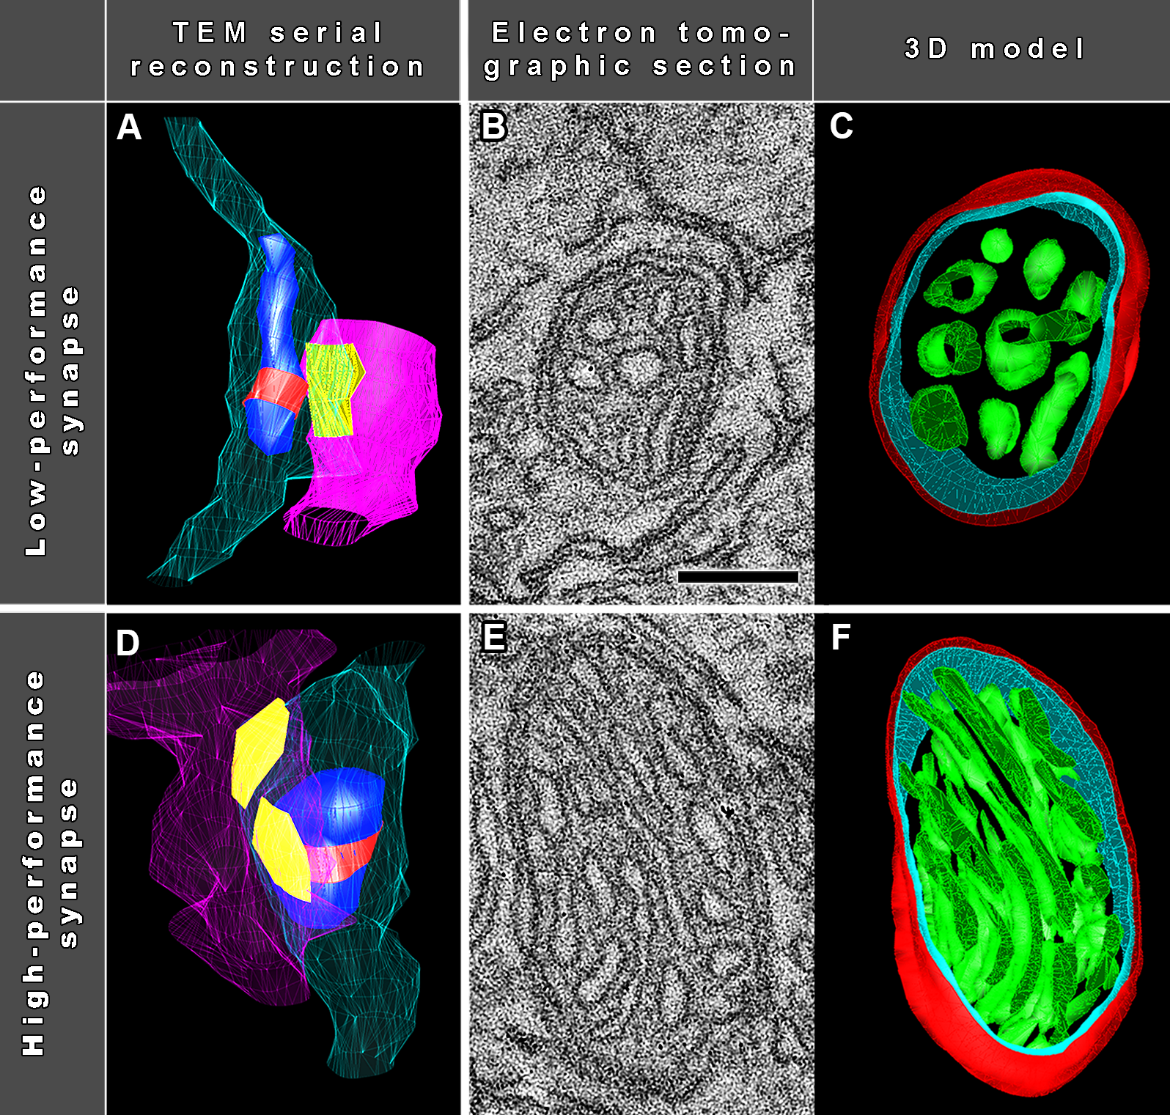 Figure 1. Mitochondrial Ultrastructure is Optimized for Synaptic Performance
Read the full article:
Mitochondrial Ultrastructure Is Coupled to Synaptic Performance at Axonal Release SitesCsaba Cserép, Balázs Pósfai, Anett Dóra Schwarcz, and Ádám Dénes
FOLLOW US
 RSS Feed
POPULAR POSTS
TAGS
CATEGORIES


