Standardized Dendritic Spine Characterization to Improve Reproducibility in Disease Models
Juan C Sanchez-Arias is currently a PhD candidate, and Simona D Frederiksen a postdoctoral researcher at the University of Victoria, Victoria, British Columbia, Canada. You can follow them on Twitter @juan_sanar and @sd_frederiksen
Most excitatory synapses in the cerebral cortex are located in dendritic spines—miniature specialized structures that play a critical role in neurotransmission within neural networks. Previous studies have shown that the filamentous form of actin (F-actin, a major cytoskeletal component) partially regulates the morphological and functional properties of dendritic spines. Various neurodegenerative diseases are associated with a loss of dendritic spines and morphological and functional changes in dendritic spine properties. For example, in early disease stages, aberrant F-actin organization in dendritic spines has been observed in Alzheimer’s disease mouse models (Rush et al., 2018; Kommaddi et al., 2018), and loss of cortical and hippocampal synapses has been documented in post-mortem brains of Alzheimer´s disease patients (Davies et al., 1987; Scheff et al., 2006, 2007). As the shape of dendritic spines is strongly associated with spine maturity and function, a standardized method to categorize spine shape could enhance the reproducibility of findings underlying synaptic transmission in various neurological disease models and rare samples of human brain tissue. Despite attempts to efficiently characterize spine shape, objective and high-throughput approaches have not kept pace with recent technological advances in microscopy and digital image analysis. Nanguneri and colleagues developed a novel paradigm to characterize objectively dendritic spine shape based on F-actin morphology.
The authors achieved nanoscale morphological characterization of dendritic spines by combining advanced super-resolution microscopy (direct stochastic optical reconstruction microscopy; dSTORM) with digital image processing tools such as ThunderSTORM and super-resolution by radial fluctuations (SRRF). This compound strategy overcomes the limit of resolution in optical systems (diffraction barrier) and enables ~20-40 nm optical super-resolution. Primary hippocampal neurons from neonatal rats were labeled with conjugated dyes for F-actin and Homer-1c, an excitatory postsynaptic protein. Colocalization of the markers enabled the identification of dendritic spines. These super-resolution dSTORM images were further processed using two methods (Figure 1): TWS (trainable Weka segmentation; Arganda-Carreras et al., 2017), and ANNA-PALM (artificial neural network accelerated photoactivated localization microscopy; Ouyang et al. 2018)
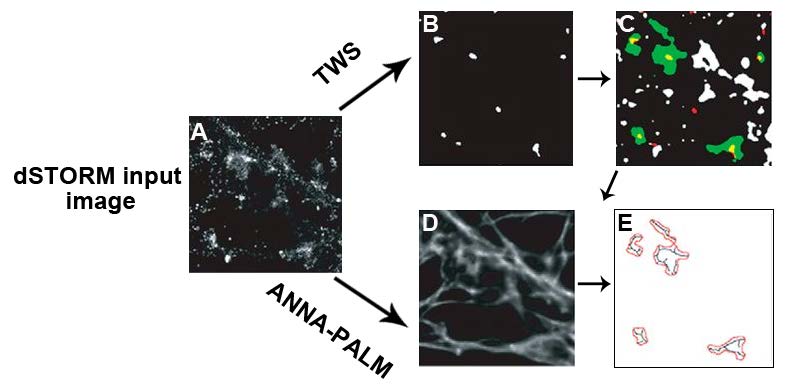
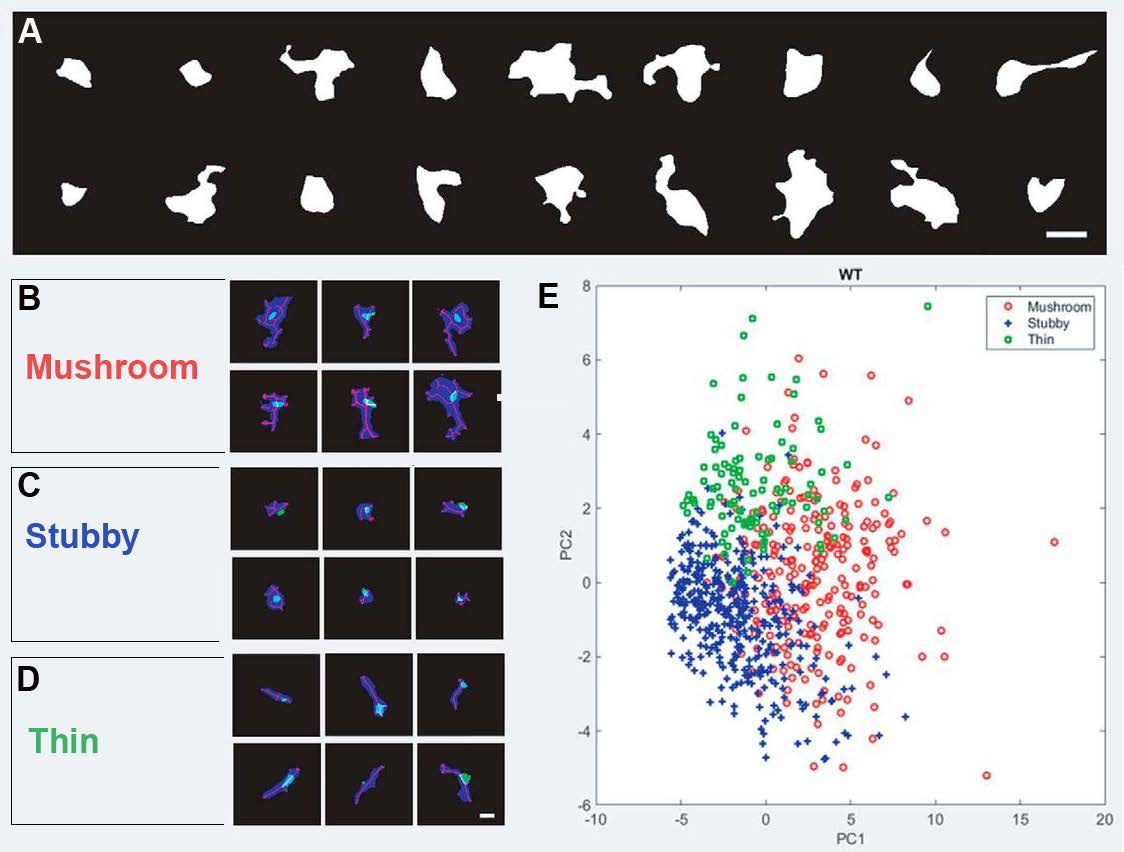
To classify dendritic spines according to the nanoscale architecture at the postsynapse, sub-diffraction resolution images of Homer-1c were obtained by coupling dSTORM images with NanoJ, an ImageJ plugin that contains analytical tools for SRRF (used to improve further the resolution of dSTORM images). SRRF overcomes the diffraction barrier by a factor of 2—the pixels are magnified into subpixels, and for each pixel, the probability of containing a fluorophore is calculated. The resulting F-actin and Homer-1c nanoscale images were analyzed with the supervised machine learning segmentation tool TWS that classified dendritic spines as mushroom, stubby, or thin in appearance (Figure 1B,C and Figure 2). To train this algorithm, the authors used reference images, categorized by four experts as inputs; hence, the term supervised learning. Afterward, the segmentation and classifier tool was presented with the same sample of images resulting in dendritic spine classification accuracy of 83% when compared to the experts’ classification. Importantly, there was little overlap between the three categories of dendritic morphology (Figure 2E). These three main categories were classified using a representation derived from a total of 22 different shape-based features (detected using the Shape Filter plugin in ImageJ) after applying principal component analysis (PCA), a method that can be used to reduce the complexity of data.
In parallel, super-resolution dSTORM images of the F-actin network from dendritic spines, positive for Homer-1c immunoreactivity, were also analyzed using ANNA-PALM, artificial neural network accelerated photoactivated localization microscopy. This computational strategy is capable of reconstructing microtubules at single-molecule levels with high fidelity. In this case, Nanguneri and colleagues used ANNA-PALM and the ridge detection ImageJ plugin to predict tubular/rod-like features from the F-actin network in postsynaptic compartments (Figure 1D,E). These modeled F-actin networks were used to obtain morphological measures such as spine head and neck length, as well as the length of the actin filaments within spines.
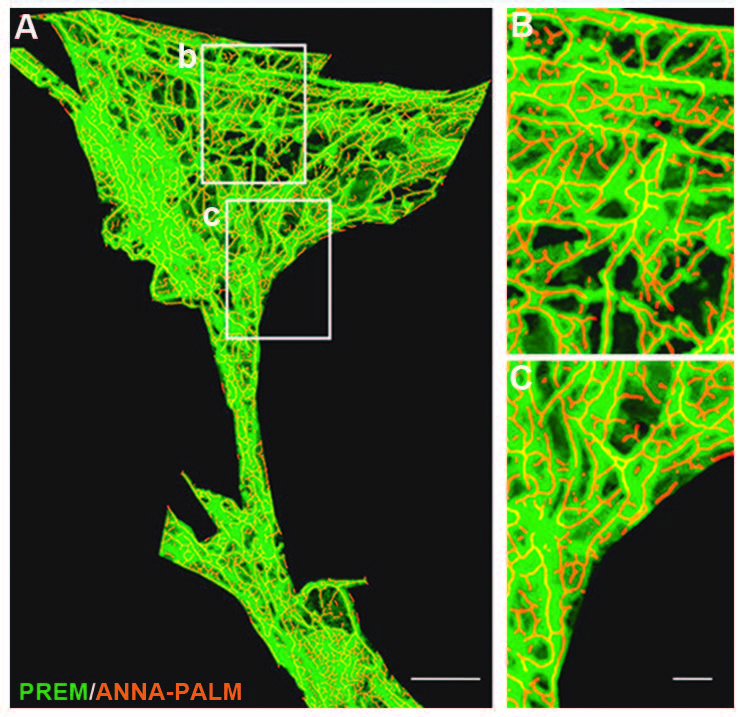
A key experiment performed by the authors was validating the accuracy of the reconstructed and modeled F‑actin tubular network derived from processing dSTORM super-resolution images using ANNA-PALM. For this, hippocampal neuronal cultures were processed for platinum replica electron microscopy (PREM), a technique capable of achieving a lateral resolution of 2.5 nm. A strong correlation was found between PREM images of the F-actin network and dSTORM (Figure 3), validating the use of dSTORM and the proposed analytical framework as a sound method to visualize and analyze the actin cytoskeleton in dendritic spines at a nanoscale resolution.
To showcase the application of this novel framework for dendritic spine analysis and classification, the authors used their machine learning approach on a previously published repository of dSTORM images of cortical neurons isolated from wild-type mice and a mouse model of Alzheimer’s disease (Kommaddi et al., 2018). The dendritic spines in cortical neurons from wild-type and transgenic APP/PS1 mice (which carry mutations in Amyloid Precursor Protein [APP] and Presenilin 1 [PS1]) were classified based on shape with an accuracy of at least 86%. The number of mushroom (mature) spines was significantly reduced in APP/PS1 neurons, with a corresponding increase in the number of stubby and thin (immature) spines. By studying the F-actin network, the authors also discovered that the cumulative length of individual actin filaments in the head of mushroom spines from APP/PS1 neurons was significantly reduced compared to wild-type mushroom spines. These findings add to the evidence of actin cytoskeleton derangements in Alzheimer’s disease.
In summary, by merging the power of machine learning with single molecule-based super-resolution microscopy, Nanguneri and colleagues provide the research community with a creative and novel framework to efficiently and objectively classify dendritic spines and characterize their F‑actin network. Future work should explore other cytoskeletal elements in dendritic spines (microtubules, actin- and tubulin-associated proteins), with or without synaptic elements (Homer-1c, PSD-95, excitatory postsynaptic receptors). Additionally, studying these compartments at different neurodevelopmental timepoints and in the context of interactions with other cell types will provide additional insights into how dendritic spine morphology and function are regulated in health and disease.
Read the full article:
Characterization of Nanoscale Organization of F-Actin in Morphologically Distinct Dendritic Spines In Vitro Using Supervised Learning
Siddharth Nanguneri, R. T. Pramod, Nadia Efimova, Debajyoti Das, Mini Jose, Tatyana Svitkina, and Deepak Nair
This Reader's Pick was reviewed and edited by eNeuro Features Editor Rosalind S.E. Carney, D.Phil.
References:
- Arganda-Carreras I, Kaynig V, Rueden C, Eliceiri KW, Schindelin J, Cardona A, Sebastian Seung H. (2017) Trainable Weka Segmentation: a machine learning tool for microscopy pixel classification. Bioinformatics 33(15):2424-2426. doi:10.1093/bioinformatics/btx180
- Davies CA, Mann DMA, Sumpter PQ, Yates PO (1987) A quantitative morphometric analysis of the neuronal and synaptic content of the frontal and temporal cortex in patients with Alzheimer’s disease. Journal of the Neurological Sciences 78:151–164. doi:10.1016/0022-510x(87)90057-8
- Kommaddi RP, Das D, Karunakaran S, Nanguneri S, Bapat D, Ray A, Shaw E, Bennett DA, Nair D, Ravindranath V (2018) Aβ mediates F-actin disassembly in dendritic spines leading to cognitive deficits in Alzheimer’s disease. J Neurosci 38:1085–1099. doi:10.1523/JNEUROSCI.2127-17.2017
- Ouyang W, Aristov A, Lelek M, Hao X, Zimmer C (2018) Deep learning massively accelerates super-resolution localization microscopy. Nat Biotechnol 36(5):460-468. doi:10.1038/nbt.4106.
FOLLOW US
 RSS Feed
POPULAR POSTS
TAGS
CATEGORIES


