Where Do Growth Cones Get Their Energy From?
Axon pathfinding is a dynamic process that requires high spatiotemporal efficiency and accuracy to ensure that neural circuits are correctly established. Growth cones are specialized structures at the distal tip of growing axons that can sample the local environment for chemoattractive/chemorepulsive signals known as guidance cues. They do so by locally extending protrusions called filopodia in several directions. Rapid retraction of filopodia in chemorepulsive environments facilitates axon extension into new local territories. The speed at which the local environment is sampled is costly in terms of energy expenditure. Therefore, it is assumed that the main source of energy in cells— mitochondria—must be properly positioned within the distal part of axons during dynamic activity. From studies by others, it was known that the mitochondrial membrane protein Syntaphilin (Snph) contributes to the immobilization of mitochondria on microtubules. Such immobilization can facilitate high energy needs, such as in active synapses. However, it was not known if Snph also regulates mitochondrial positioning in growth cones during axon pathfinding in vivo. Verreet and colleagues answered this question by performing in vivo time-lapse imaging of fluorescently labeled mitochondria and growing retinal axons in zebrafish embryos.
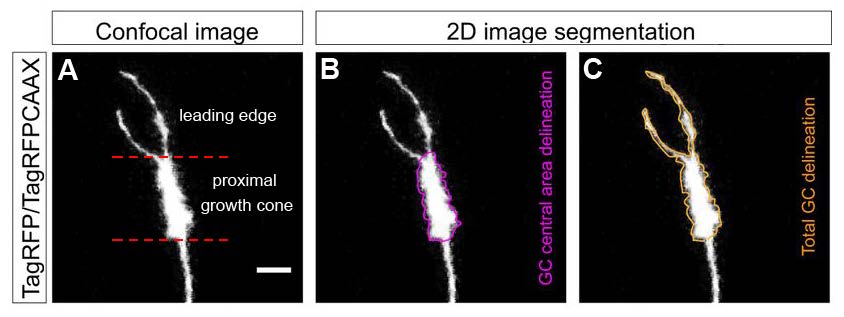
Zebrafish embryos are a good model for studying axon growth due to their transparency and relative ease of experimental manipulation. The authors targeted expression of reporters TagRFP/TagRFPCAAX and mitoEGFP to enable visualization of plasma membrane/actin filaments and mitochondria in red and green fluorescence, respectively. Plasmids encoding the fluorescent reporters were injected into one-cell stage zebrafish embryos. At 30–32 hours post-fertilization (hpf), the right eye of zebrafish embryos was removed to observe individual retinal axons extending along the contralateral optic tract towards the optic tectum. Time-lapse images were recorded between 50 and 55 hpf for up to 3 hours at 1-minute intervals. TagRFP/TagRFPCAAX expression was used to manually delineate central and total growth cones areas (Figure 1). The authors calculated a measure of mitochondrial occupancy in central versus total growth cone areas. Kymograph analyses enabled the authors to also quantify anterograde and retrograde transport of mitochondria in the distal axon. 2D and 3D images were analyzed using ImageJ.
Consistent with observations by others, the authors found that growth cone morphology was linked to two states of axon growth in wild-type zebrafish embryos. Compared to “advancing” growth cones (Movie 1), “pausing” growth cones were more round with more filopodia that extended in a broader range. The mitochondrial occupancy was similar in advancing and pausing axons. Mitochondria were predominantly positioned in the central growth cone area, although some “pioneering” mitochondria were present at the leading edge of the growth cone. Mitochondrial transport towards the growth cone was positively correlated with increased axon elongation.
Movie 1. Representative time-lapse recording of mitochondrial dynamics in an advancing growth cone. Time-lapse video showing mitochondria (green, white) in a distal retinal axon and growth cone (red) elongating along the optic tract. Images were acquired at 1 min intervals for 48 min. Each frame is a confocal image stack maximal projection, lateral view, and anterior is on the left. Time stamp format: hours:minutes (hr:min). Scale bar, 5 μm. (Movie 2 in Verreet et al., 2019.)
Movie 2. Representative time-lapse recording of mitochondrial dynamics in a growth cone of a snph db mutant embryo. Time-lapse video showing mitochondria (green, white) in a distal retinal axon and growth cone (red) elongating along the optic tract of a snph db embryo. Images were acquired at 1 min intervals for 96 min. Note that the growth cone is combining periods of pausing with advancing (from 00:00 to 00:10 and 00:53 till end). Each frame is a confocal image stack maximal projection, lateral view, and anterior is on the left. Time stamp format: hours:minutes (hr:min). Scale bar, 5 μm. (Movie 7 in Verreet et al., 2019.)
Verreet and colleagues next determined whether Snph plays a role in mitochondrial positioning in zebrafish distal axons. The authors first used in situ hybridization and confirmed that two Snph isoforms snpha and snphb are expressed in retinal ganglion cells during development. They also showed that Snphb localizes to the distal growth cones of retinal axons when exogenously expressed. The authors subsequently generated snpha and snphb double mutants (snph db) to test the function of both proteins and eliminate any potential compensation of snpha function by snphb and vice versa. As before, one-cell stage snph db zebrafish embryos were injected with TagRFP/TagRFPCAAX and mitoEGFP plasmids. The absence of snpha and snphb expression resulted in fewer mitochondria within the central and total growth cones areas (Movie 2). In addition, the double mutants had fewer pioneering mitochondria, even though the total number of mitochondria within the overall growth cone peripheral volume was similar to wild-type zebrafish. Further analyses revealed that although the number of mitochondria that arrived at the growth cone was comparable between wild-type and snph db groups, more mitochondria subsequently left the growth cone of the double mutant. These observations indicate that Snph contributes to the maintenance of mitochondrial positioning within the growth cone. Growth cone morphology and axon elongation rates were however, not affected by the loss of Snpha and Snphb.
This publication advances our knowledge of mitochondrial dynamics during axon growth in vivo. The authors demonstrate several well-defined time-lapse imaging methods and observations of mitochondrial occupancy and transport within wild-type developing retinal axons in zebrafish. These findings lend support to prior in vitro studies of the interaction between mitochondria and cytoskeletal elements during axon growth and synaptic activity in rodents. The zebrafish is a good model to help address the conservation of protein function across vertebrate species. In this study, the authors showed that Snph does contribute to mitochondrial positioning in the growth cones of retinal axons in zebrafish. However, loss of Snph function did not affect growth cone morphology or axon growth rate. Future studies may determine if other mitochondrial outer membrane proteins, such as the GTPases Miro1 and 2 contribute to mitochondrial immobilization in the growth cone of developing retinal axons in zebrafish.Read the full article:
Syntaphilin-Mediated Docking of Mitochondria at the Growth Cone Is Dispensable for Axon Elongation In VivoTine Verreet, Cory J. Weaver, Hiromu Hino, Masahiko Hibi, and Fabienne E. Poulain
FOLLOW US
 RSS Feed
POPULAR POSTS
TAGS
CATEGORIES


