Snapshots in Neuroscience: Orexin receptor expression
This image has been selected to showcase the art that neuroscience research can create.
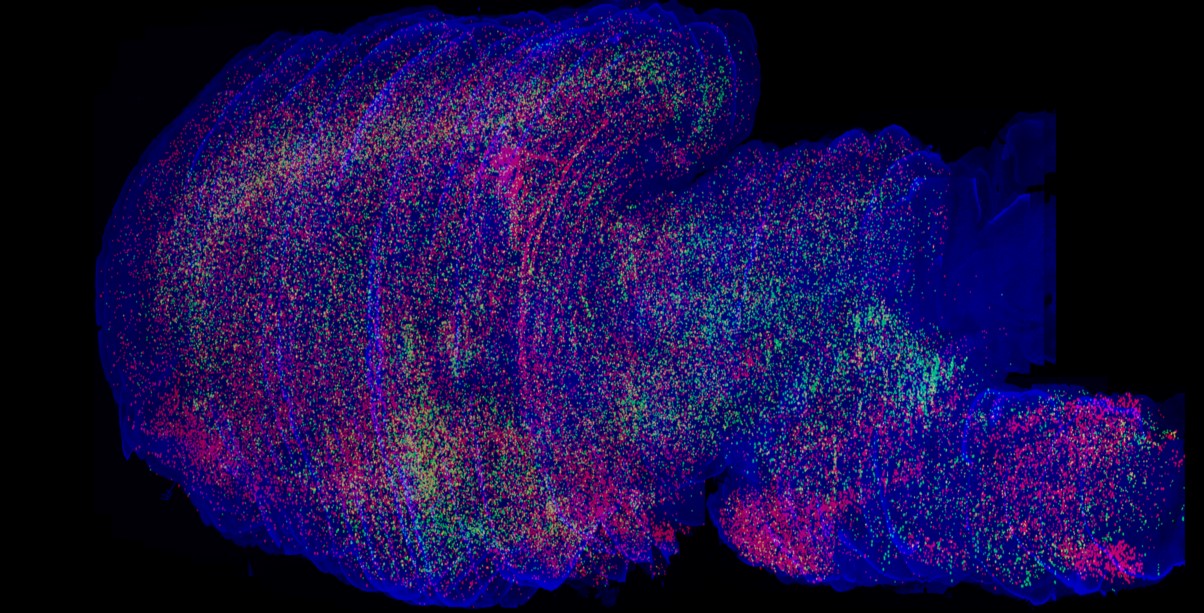
As described by Drs. Yousuke Tsuneoka and Hiromasa Funato: This image is a lateral view of a reconstructed 3-dimensional distribution of orexin receptor type 1 (Ox1r)-expressing cells (green) and orexin receptor type 2 (Ox2r)-expressing cells (red) of a mouse brain. Ox1rl and Ox2r mRNAs were visualized using branched hybridization chain reaction (bHCR) method with Hoechst 33342 (blue) for nuclear stain.
The whole-brain mapping of orexin receptors showed that the density of orexin receptor-positive cells largely varied among brain regions. Cells expressing both Ox1r and Ox2r (yellow) were observed in limited brain regions.
Fluorescence photomicrographs of a series of 40 μm-thick coronal sections of the entire brain of a single mouse were obtained using a Nikon Eclipse Ni microscope equipped with the A1R confocal detection system. Green or red dots for Ox1r- or Ox2r-expression cells were manually plotted on the original fluorescence images and then reconstructed into a 3-dimensional image.
Read the full article:
Whole Brain Mapping of Orexin Receptor mRNA Expression Visualized by Branched In Situ Hybridization Chain Reaction
Yousuke Tsuneoka and Hiromasa Funato
FOLLOW US
 RSS Feed
POPULAR POSTS
TAGS
CATEGORIES


