Most Shared Articles of January/February
March 14, 2019
From the Jan/Feb 2019 issue (Vol. 6, Iss. 1), the articles receiving the highest Altmetric Attention Score (Altmetric LLP) are listed below.
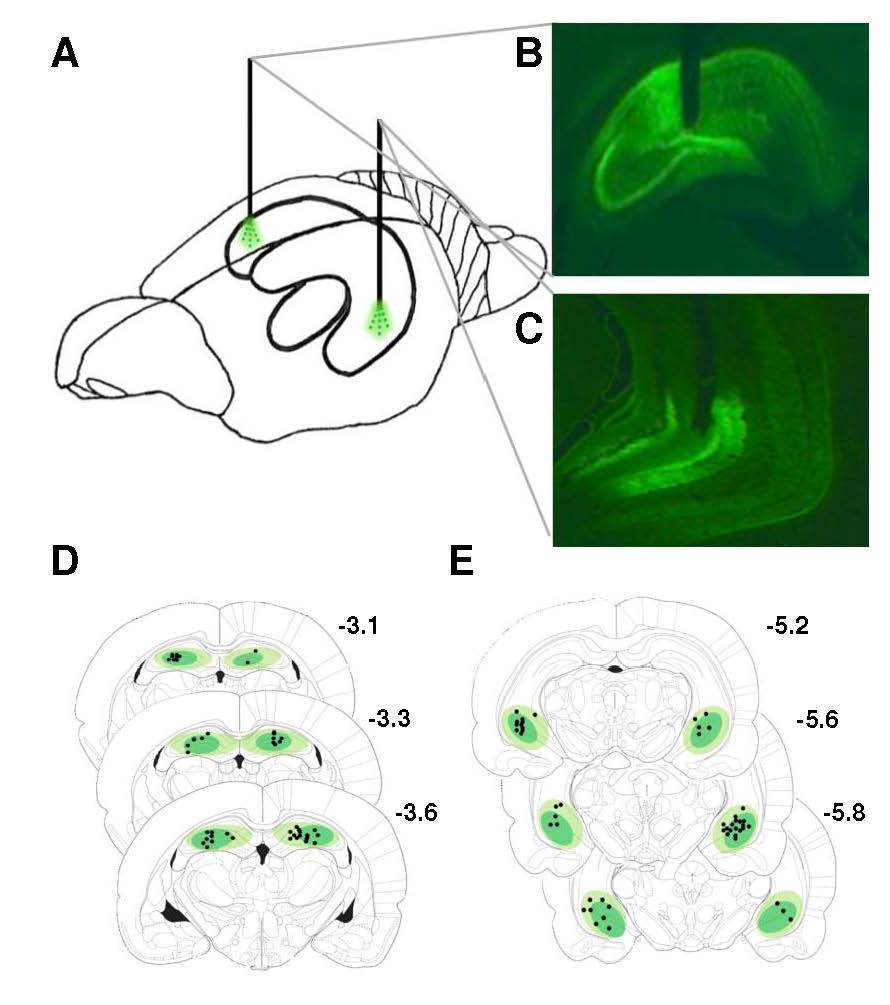
Reilly Hannapel, Janavi Ramesh, Amy Ross, Ryan T. LaLumiere, Aaron G. Roseberry and Marise B. Parent
____________________________________________________________________________________
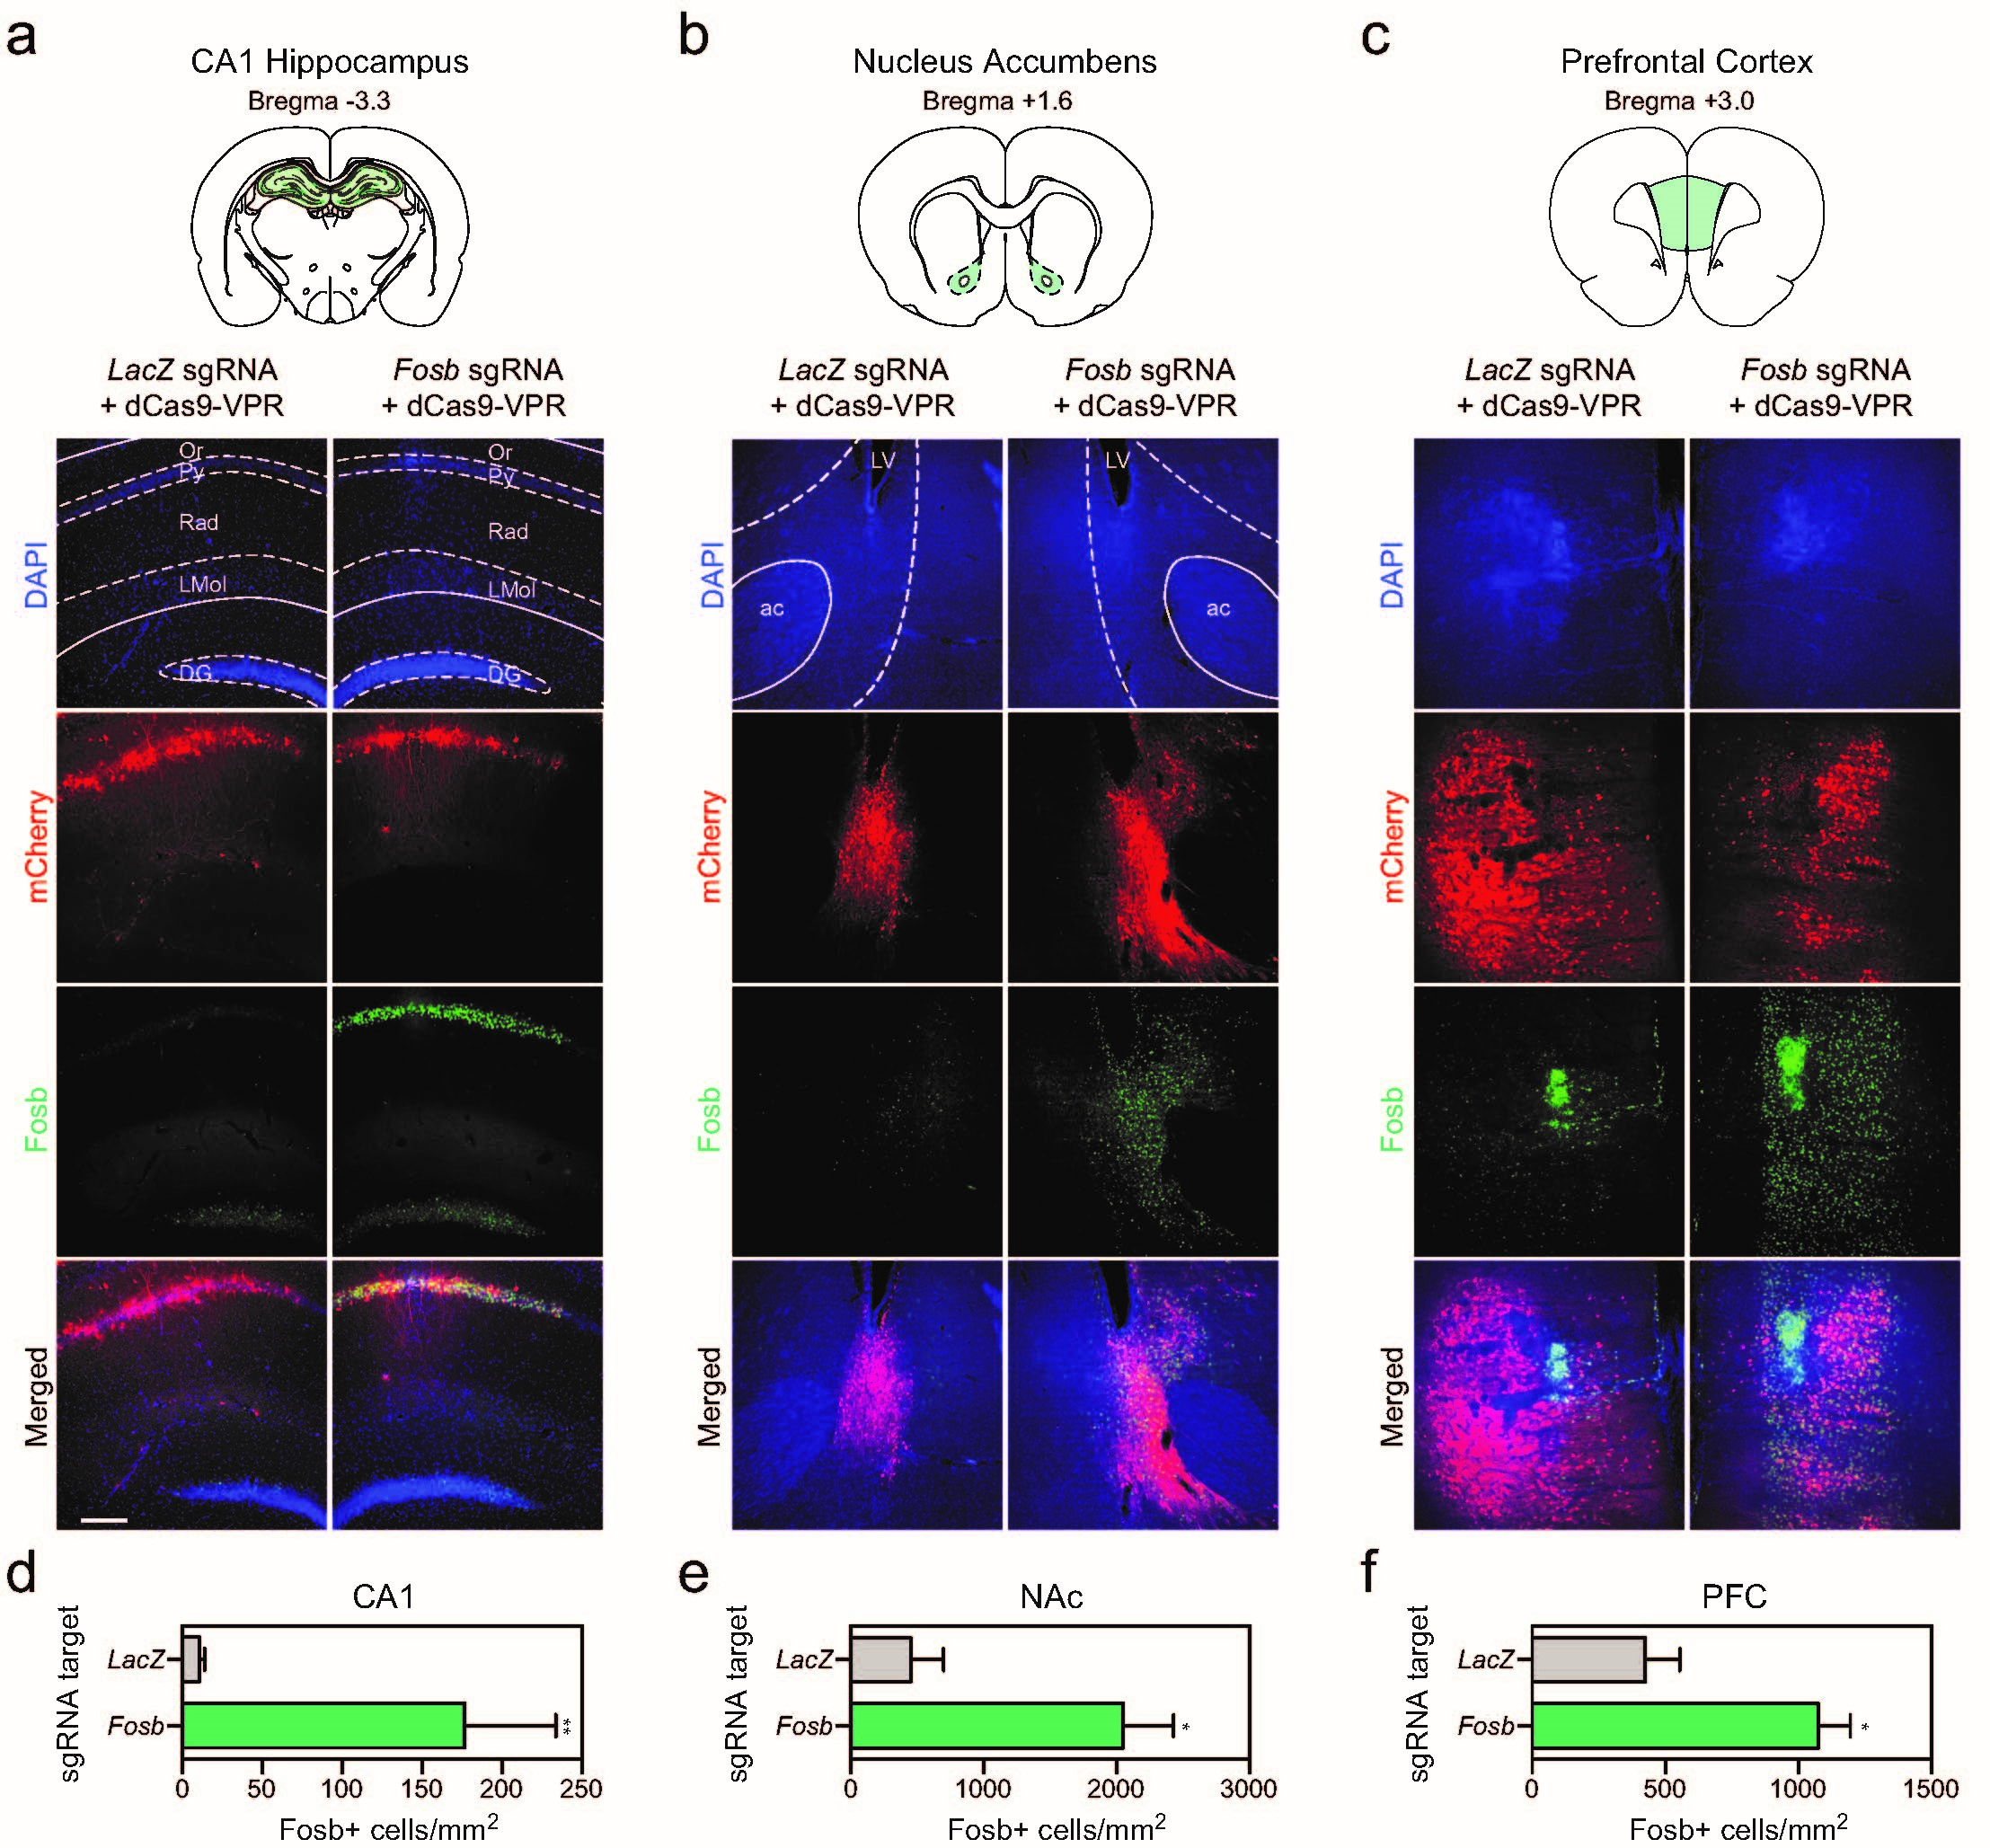
Katherine E. Savell, Svitlana V. Bach, Morgan E. Zipperly, Jasmin S. Revanna, Nicholas A. Goska, Jennifer J. Tuscher, Corey G. Duke, Faraz A. Sultan, Julia N. Burke, Derek Williams, Lara Ianov and Jeremy J. Day
____________________________________________________________________________________
![Figure 1 . OD plasticity is preserved in V1 of old EE-mice. A, Examples of optically recorded activity maps induced by visual stimulation of the contralateral and ipsilateral eye in the binocular part of V1 of SC- and EE-raised mice, without (no MD) or after 7 d of MD. Gray scale-coded activity maps [numbers in the top right corner correspond to the quantified V1 activation (×10−4); see gray scale, left], color-coded two-dimensional OD maps (color codes ODI; see scale to the right of OD map), and the histogram of OD scores, including the average ODI, are illustrated. MD eye is indicated by the black circle in the V1 map, open circles indicate an open eye. In both SC- and EE-mice without MD (no MD), the activity patch evoked by visual stimulation of the contralateral eye is darker than the one of the ipsilateral eye, warm colors prevail in the two-dimensional OD maps and ODI values are positive. After MD, V1 activation changes in EE mice but not in SC mice. Whereas V1 of SC mice remained dominated by the deprived (contralateral) eye, there was an OD shift toward the open eye in V1 of EE mice: after MD, V1 of EE mice was now less strongly activated by the contralateral eye so that both eyes activated V1 similarly, colder colors appeared in the OD maps, and the ODI values were lower, i.e., the ODI histograms shifted to the left (blue arrow). ant, Anterior; lat, lateral. Scale bar, 1 mm. B, C, Quantification of visual cortical activation before and after MD. ODI (B) and V1 activation (C) are illustrated. B, Optically imaged ODIs without (no MD) and with MD: symbols represent ODI values of individuals, means are marked by horizontal lines. MD is indicated by half-black squares. C, V1 activation elicited by stimulation of the contralateral (C) or ipsilateral (I) eye. Hatched bar indicates MD eye. Data represented as mean ± SEM. Statistical significance was calculated using ANOVA and p values were corrected for multiple comparisons. *p < 0.05, **p < 0.01.](-/media/DB13B98C4219498D89D3B8490D07A8FD.ashx?h=67&w=100)
Evgenia Kalogeraki, Rashad Yusifov and Siegrid Löwel
____________________________________________________________________________________
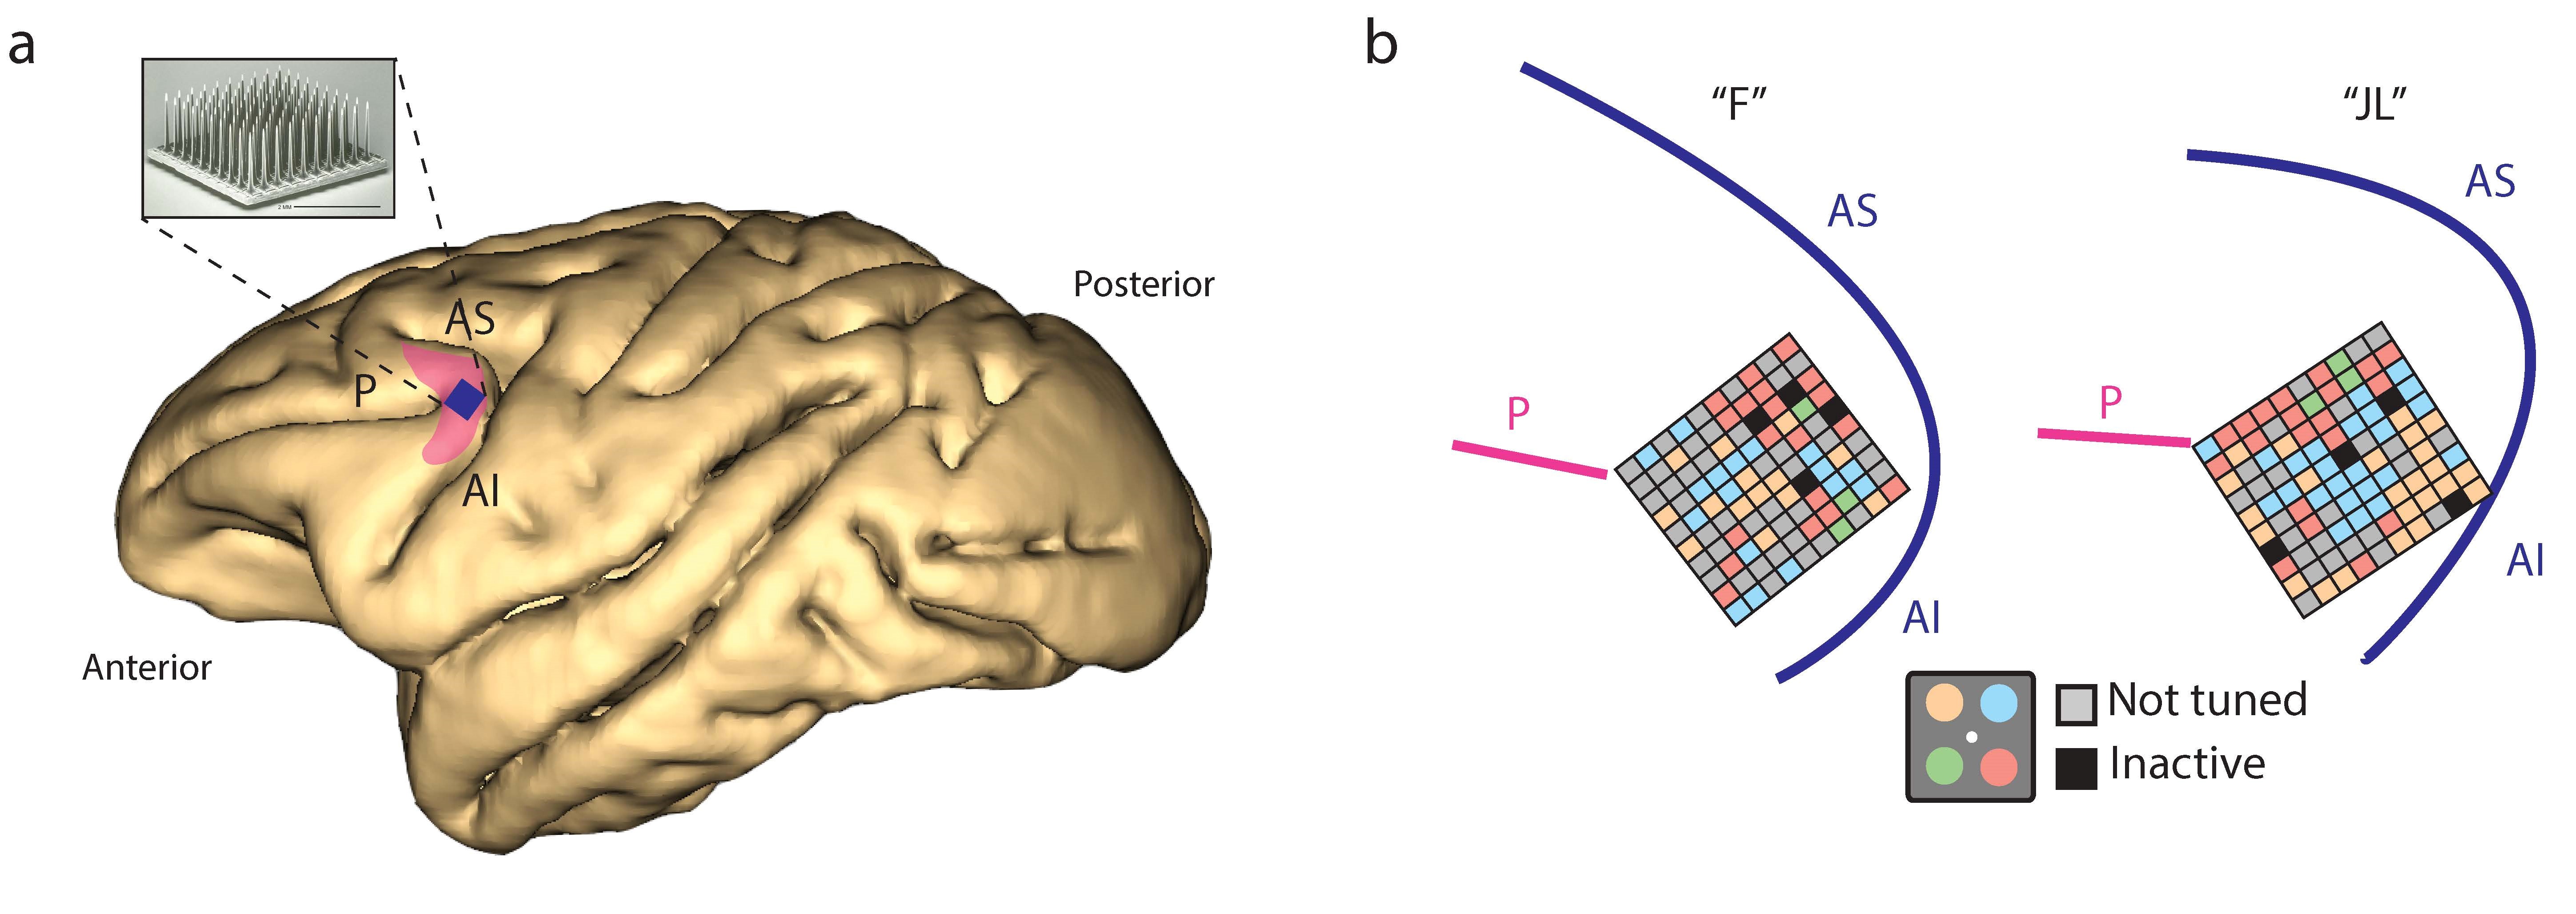
Sébastien Tremblay, Florian Pieper, Adam Sachs, Ridha Joober and Julio Martinez-Trujillo
____________________________________________________________________________________
![Figure 4. Effect of the multi-hit model on interneuron density and fate in the PFC at (A) P10 and (B) P30. GAD65 cell fate in the PFC [GAD65 (green) and BrdU (red)] of (A) mice treated with saline and reared under normoxia or subjected MIA and reared under CSH. Scale bar = 100 μm. Quantification of (A’) GAD65, (B’) GAD65 and BrdU co-labeled cell density of P10; and (A’’) GAD65, (B’’) GAD65 and BrdU co-labeled cell density at P30 in the PFC (ACC and PL are added for reference) treated with saline and reared under normoxia, subjected to with MIA and reared under normoxia, treated with saline and reared under CSH, subjected to MIA and reared under CSH. Values represent the mean (±SEM) from five to six animals out two pregnancies; *p < 0.05 (Kruskal–Wallis test with Dunn’s multiple comparisons).](-/media/F9BD8A6B54E347479368834F84B97003.ashx?h=51&w=100)
Helene Lacaille, Claire-Marie Vacher, Dana Bakalar Jiaqi J. O’Reilly, Jacquelyn Salzbank and Anna A. Penn
See the full issue:
Category: Announcement
Tags: Neuroscience Research
FOLLOW US
 RSS Feed
POPULAR POSTS
TAGS
CATEGORIES


